
In general, young adults are the most mobile among all age groups – usually moving to obtain an education, to take a job, or follow orders as a member of the military. As people age and gain more responsibilities and obligations, they tend to stay put until they approach retirement age when they may choose to move to be closer to grandchildren, natural amenities, and/or healthcare resources.
In the previous blog post, we summarized the changing trends in migration to and from North Carolina based on our analyses of migration data from the Internal Revenue Service (IRS). In this blog post, we summarize our findings regarding the changing patterns of migration by age and income.
In this analysis, we analyze the age and income characteristics of income tax filers. We calculate net migration rates by first subtracting the number of filers living in another state in the second year from those who lived in North Carolina the second year after living in another state during the first year. These numbers were then divided by the total number of filers in North Carolina in the second year. Net migration refers to the difference between the number of migrants moving into a state and the number leaving. Net migration rates (calculated on a per 1,000 people basis) are used as a way to compare migration patterns across population groups of different sizes and between North Carolina and other states.
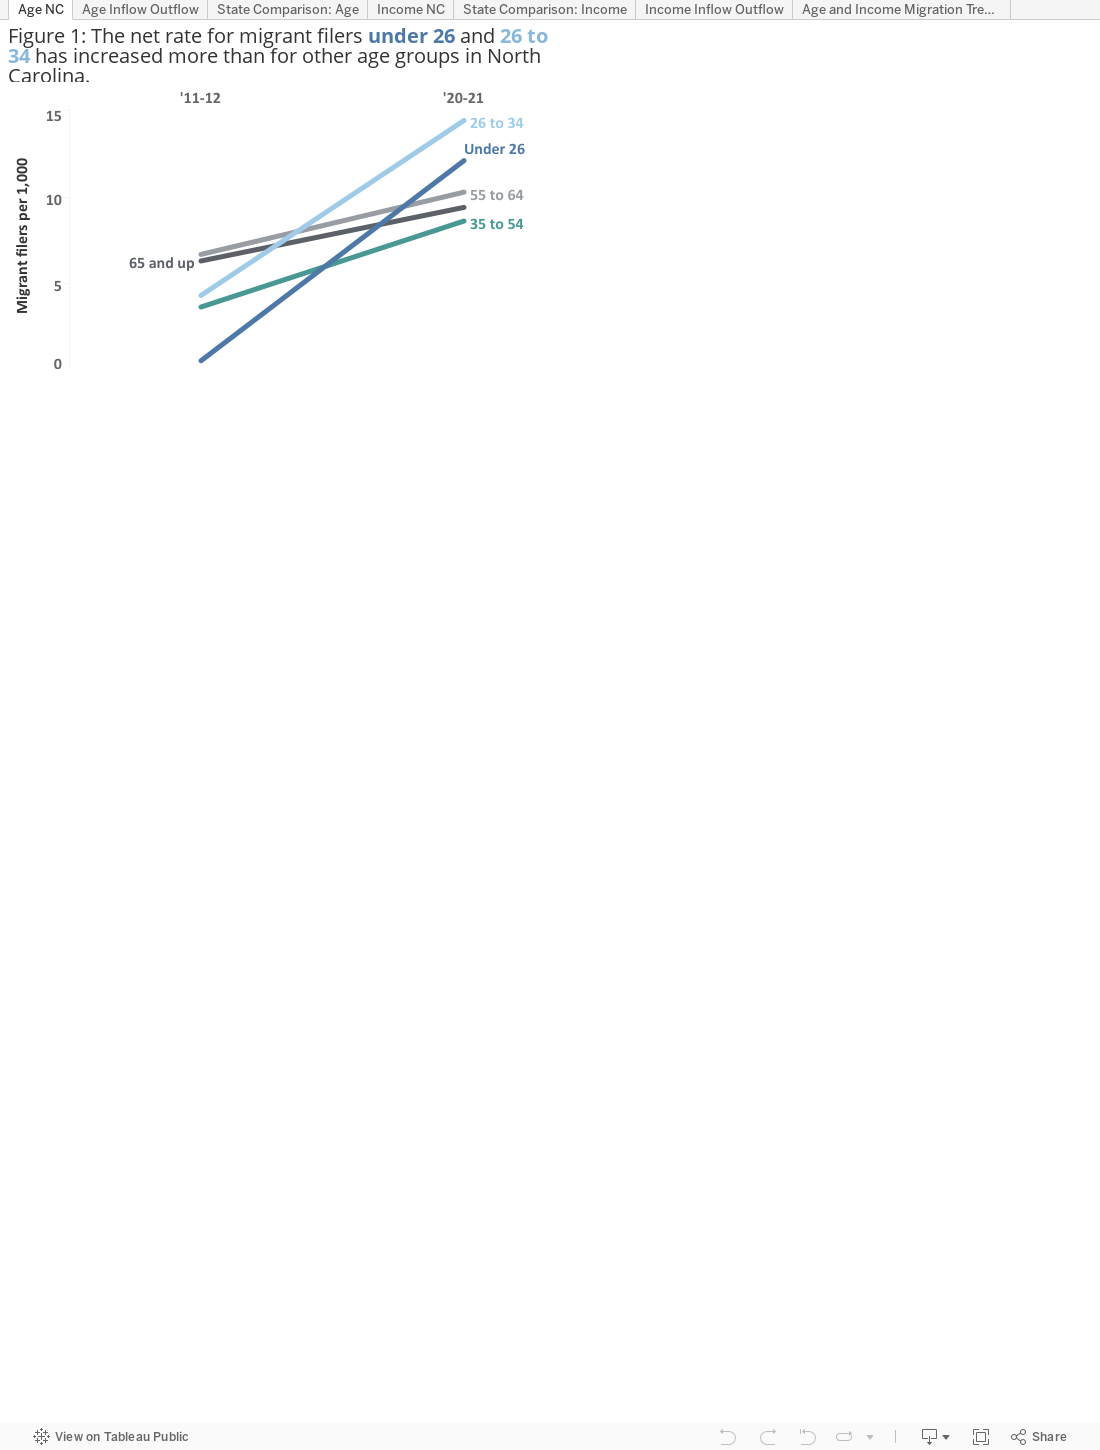
Net Migration Rates to North Carolina Have Increased for All Ages
For the two periods analyzed, net migration rates increased for all age groups but they increased most for younger migrants. The net migration rate for migrants ages 26 to 34 increased from about 4 per 1,000 at the beginning of the decade to about 14 per 1,000 at the end of the decade. Similarly, the net migration rate for migrants under 26 increased from close to zero to about 12 per 1,000 at the end of the decade.
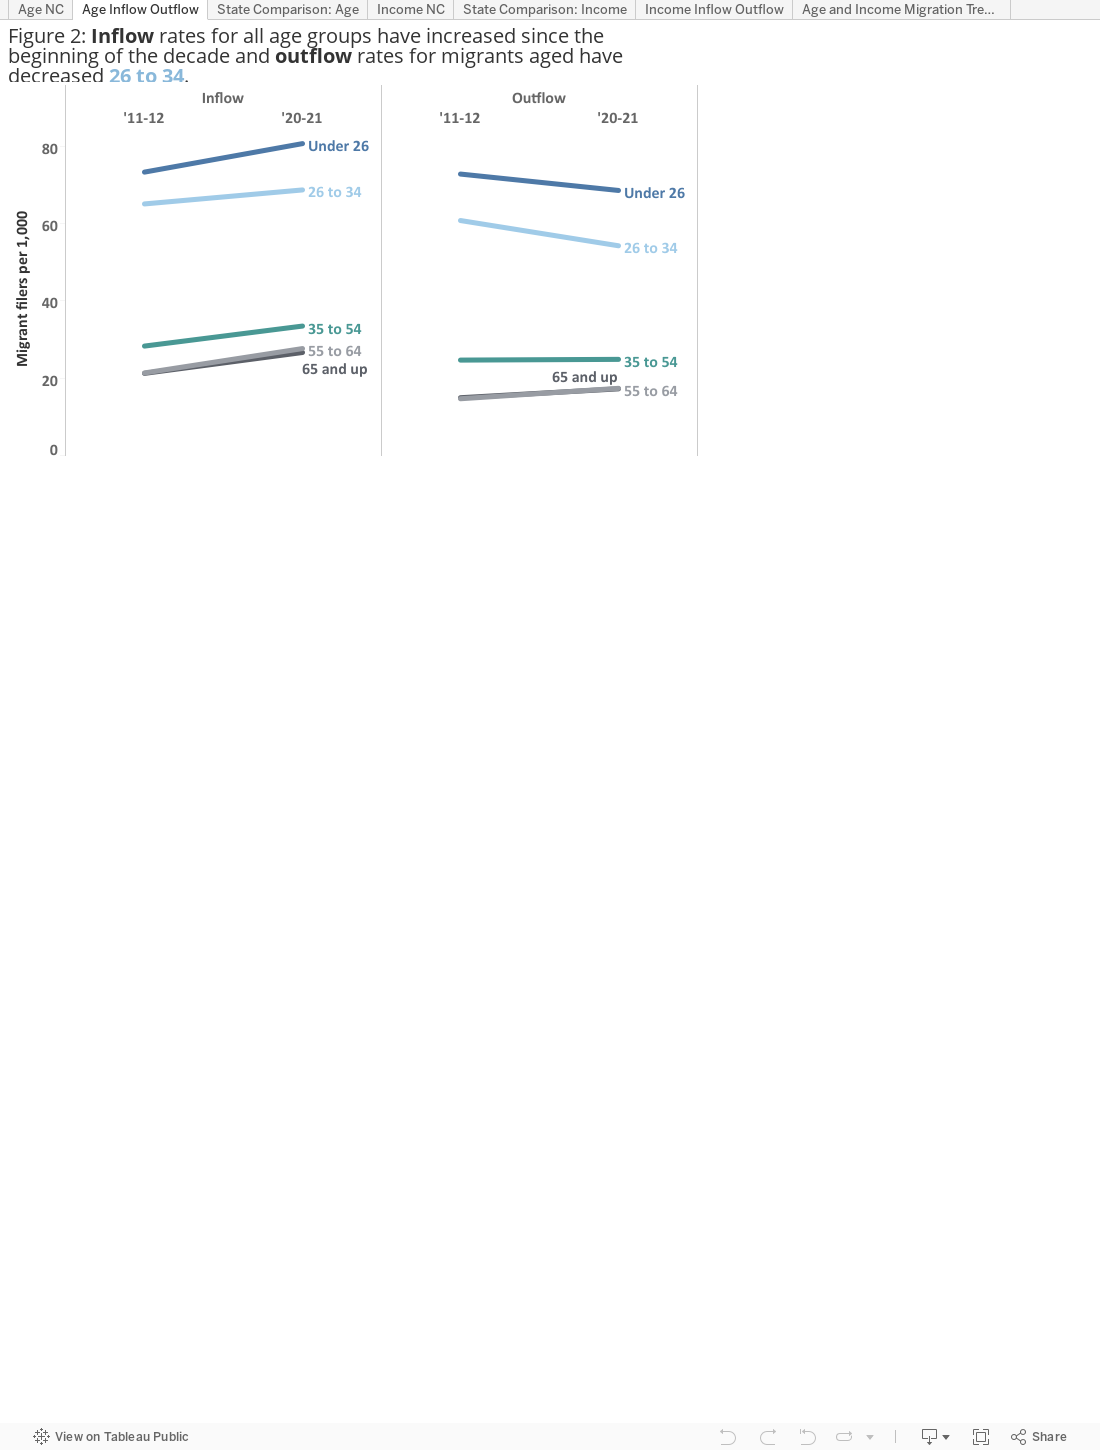
Net migration can increase from increased in-migration or decreased out-migration. Inflow rates for migrants under 34 increased while outflow rates decreased across the decade, resulting in a strong net increase for younger migrants, as shown in Figure 2.
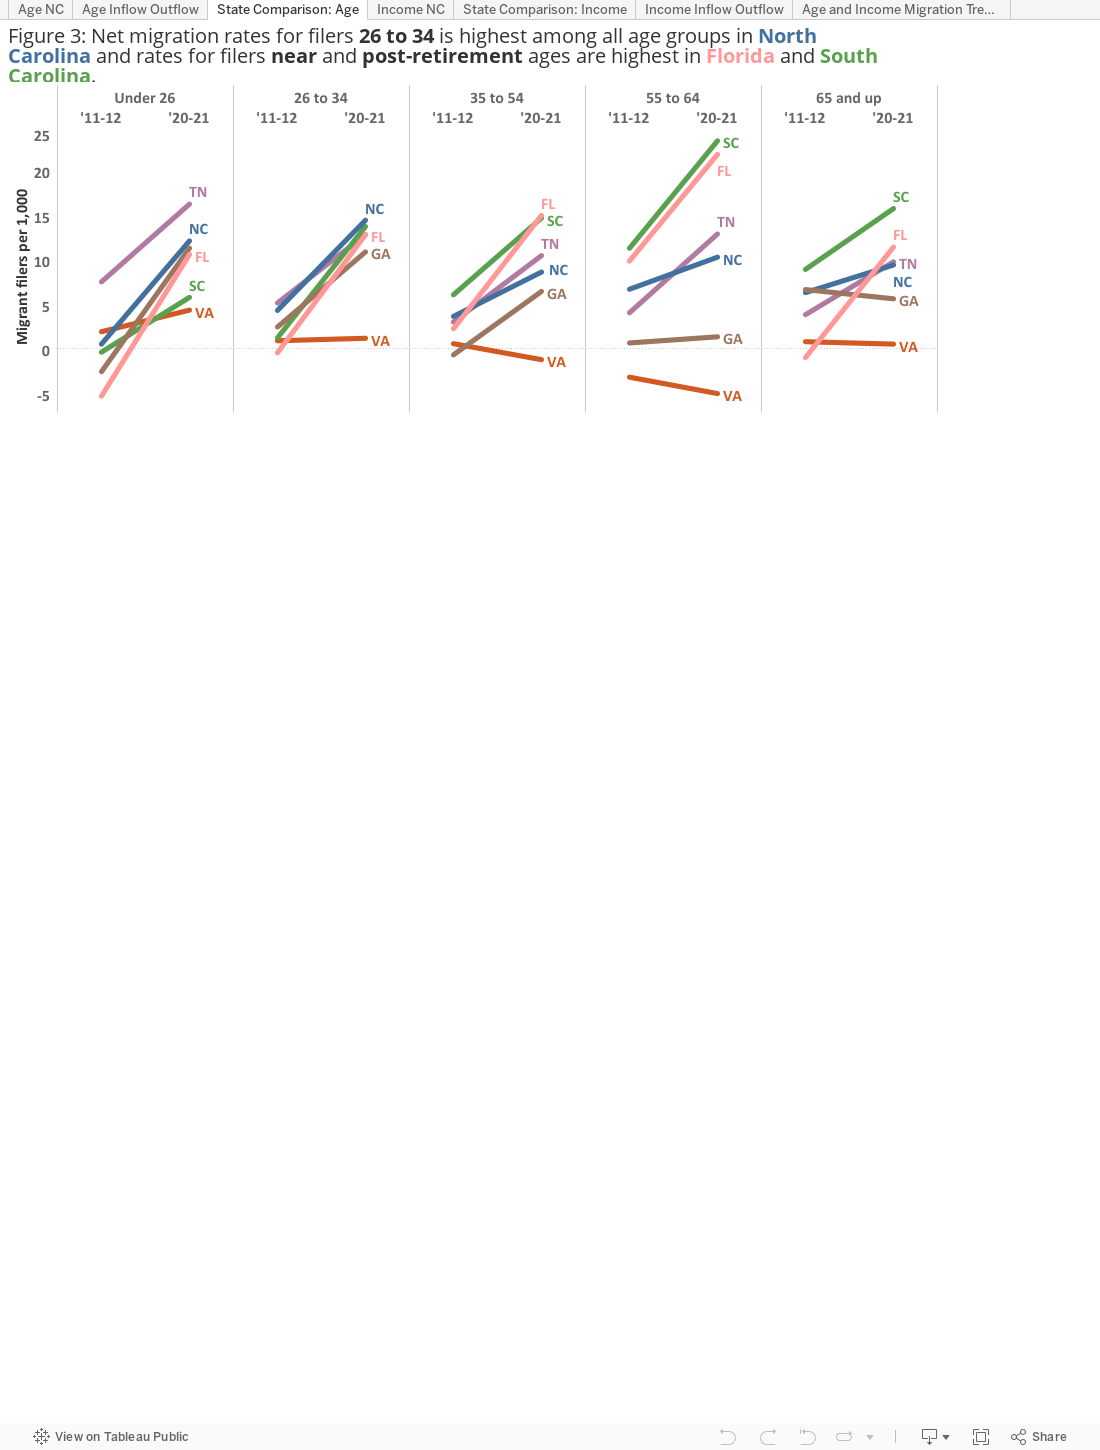
North Carolina’s Migration is More Balanced by Age than Our Neighbors
Trends in net migration rates by age differ between North Carolina and its neighbors. Changes in net migration rates across the decade are relatively balanced for North Carolina while Florida and South Carolina have experienced significant increases in rates of net migration for individuals near and post-retirement – likely owing to their role as major destinations for retirees and the aging of the Baby Boom generation (with the first set of Baby-Boomers turning 65 in 2011).
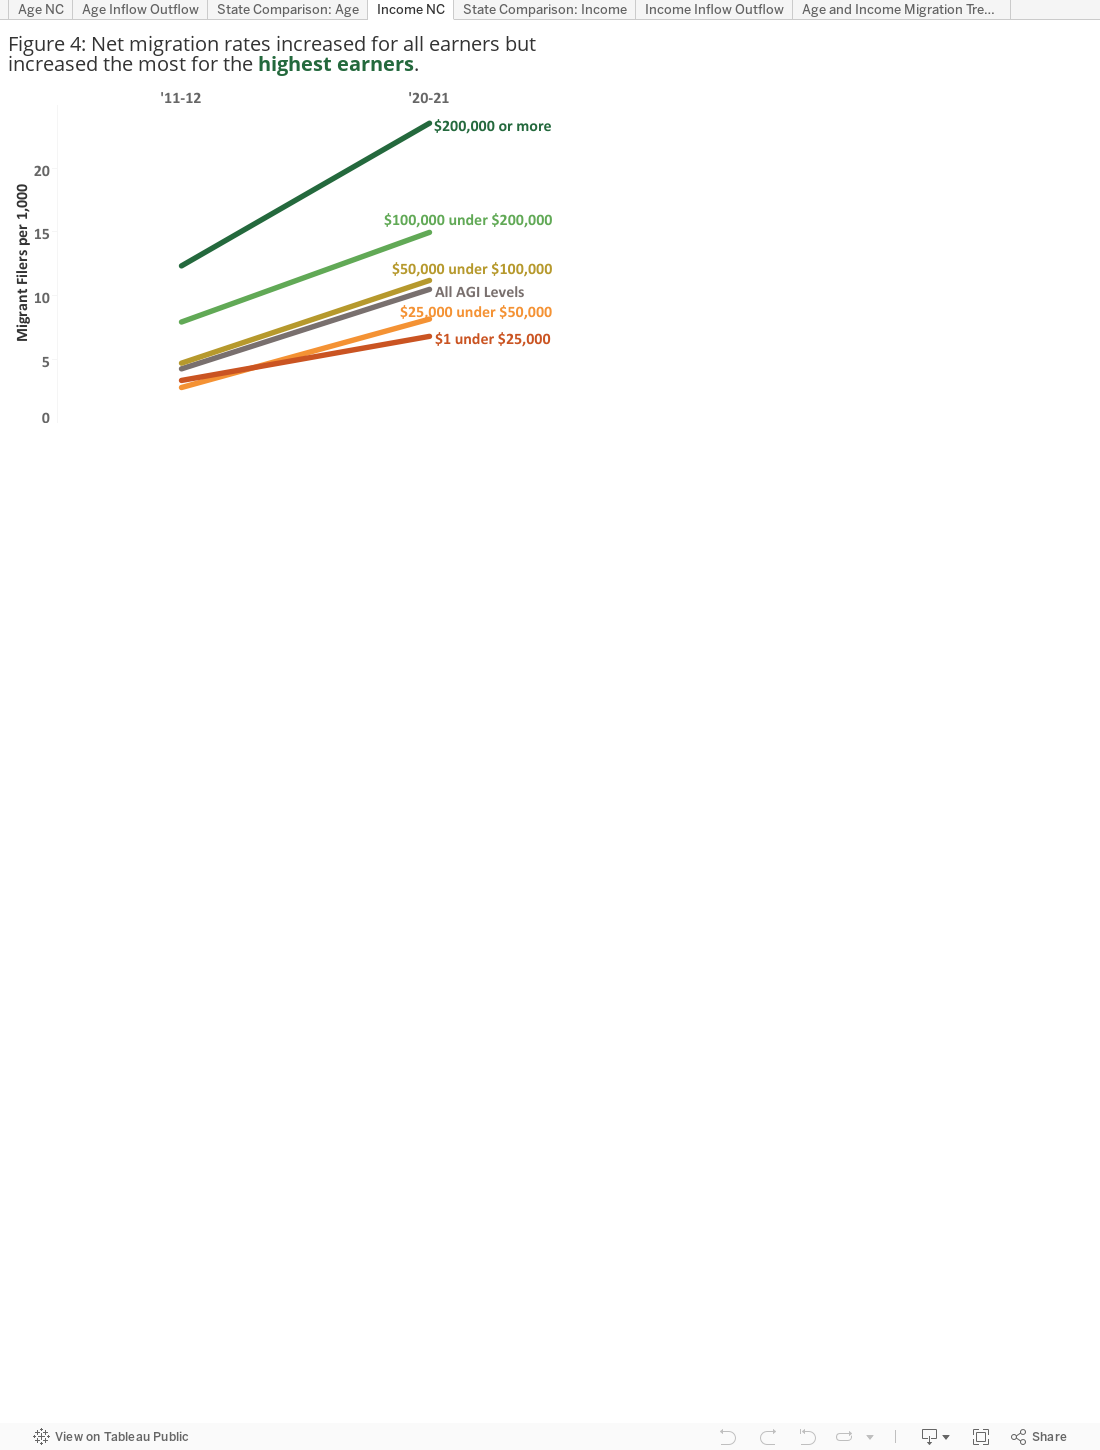
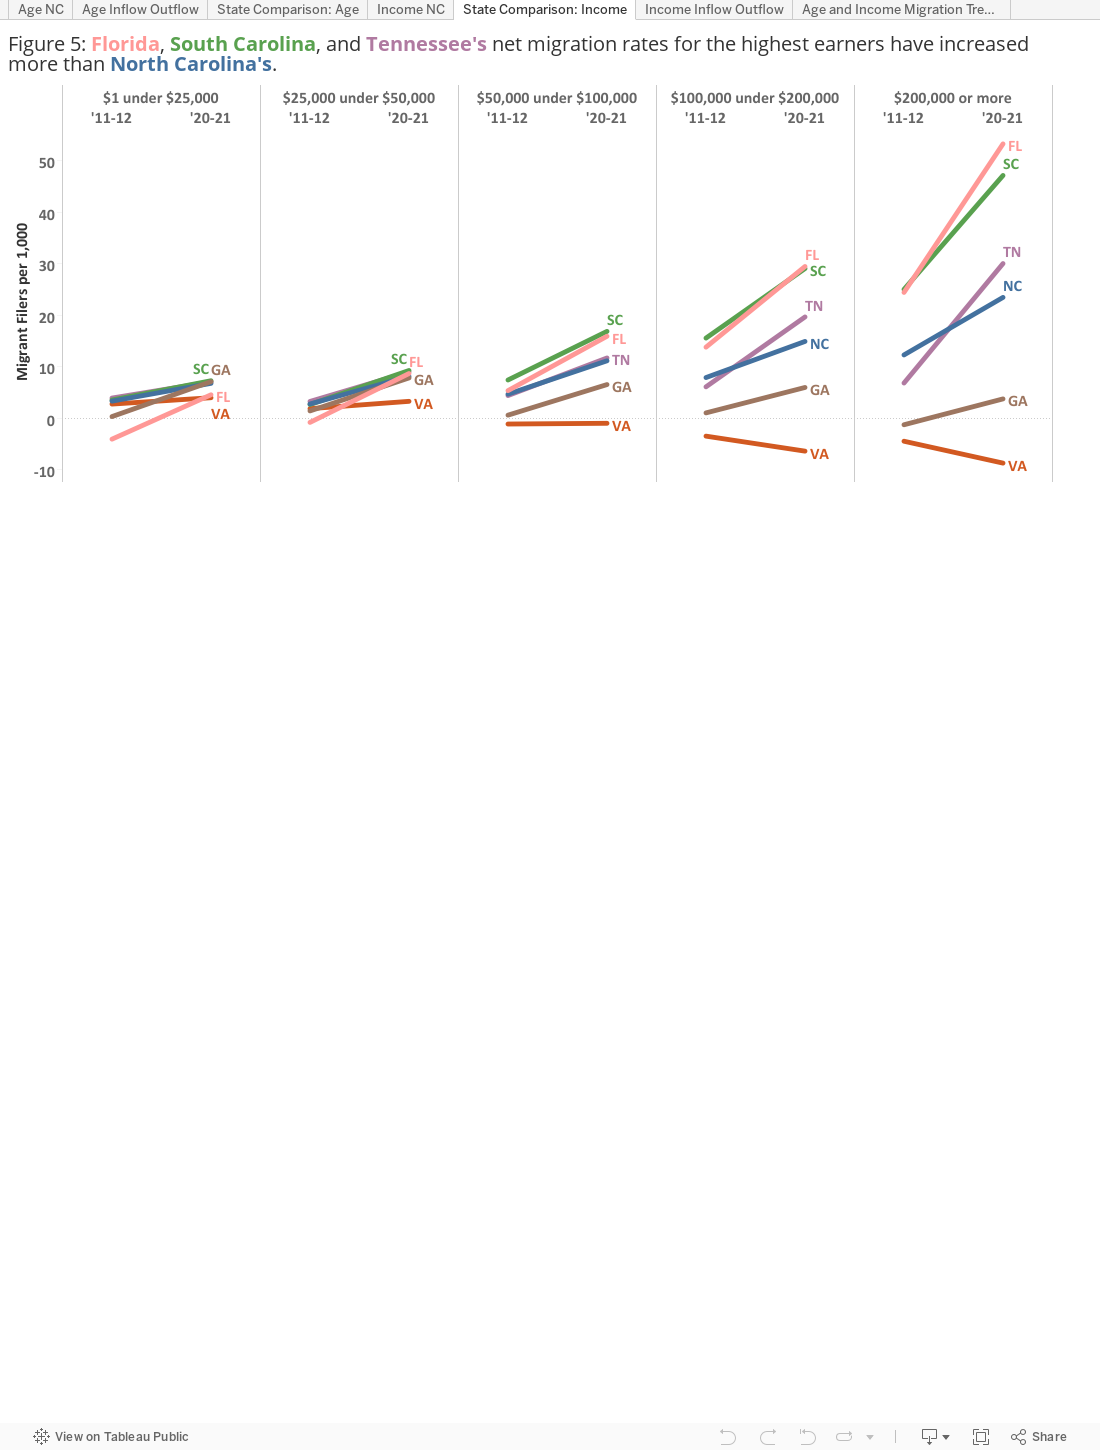
Net Migration Rates for Higher Income Earners Increase
People move for many different reasons, chief among them, job opportunities. But there are costs to such a move – particularly if you move a long distance. Thus, people who move – particularly those who move at ages beyond young adulthood – have higher incomes than those who do not. Our analysis of the IRS data shows that net migration rates increased for all income levels, but they increased the most for migrants with incomes of $200,000 or more. The net migration rate for $200,000+ earners doubled from about 12 per 1,000 at the beginning of the decade to about 24 per 1,000 at the end of the decade.
Similar patterns can be seen for all of our neighbors except Virginia – which saw increases in out-migration for the highest earners. Although net migration rates for the highest earners have increased for North Carolina, they have increased even more for its neighbors. Gains in net migration for migrants earning over $50,000 have increased more for South Carolina, Florida, and Tennessee than they have for North Carolina.
A Note on the Data
There are two components of population change – natural increase (births minus deaths) and net migration (people moving into an area minus those leaving). Of the two components of change, net migration is the most difficult to measure. Birth and deaths are registered with the government and include residence information. In the United States, there is no equivalent registration system for moves. Many different data sources are analyzed to get a clearer understanding of migration flows – including aggregated data from the IRS. The IRS data include the number of filers and the number of exemptions.
For this analysis, we analyzed data on tax filers only because of data limitations. Net migration is determined by subtracting the number of people (exemptions) living in North Carolina in 2012 or 2021 who did not live there in 2011 or 2020 from the number of people (exemptions) living in other state in 2012 or 2021 after living in North Carolina in 2011 or 2020.
Like similar data sources, there are limitations to the IRS data. Not everyone files taxes, so some people are excluded from this analysis. However, most people do file and these analyses provide a general overview of domestic migration trends. Some researchers have raised concerns about volatility in the IRS migration data produced since 2011, but no concerns have been raised about the two sets of years used in this analysis: 2011-2012 and 2020-2021.
About the Authors
Joanna LeFebvre interned with the Demographic and Economic Analysis division of the Office of State Budget and Management. She is a graduate of the Master of Public Policy, Social Policy program at Duke University’s Sanford School of Public Policy.
Dr. Michael Cline is the State Demographer of North Carolina. In addition to publishing the state's annual population estimates and projections, Dr. Cline has authored or co-authored several books, book chapters and articles