
Migration is now a primary contributor to North Carolina’s population growth, with about two-thirds of population growth derived from net migration over the last three decades. Net migration is the difference between the number of migrants coming to North Carolina and the number leaving the state. The US Census Bureau estimated that migration accounted for 95% of North Carolina’s growth between July 1, 2021 and July 1, 2022 and most of the net gains from migration were due to domestic, or state-to-state, migration – a net gain of 100,000 people.
As the population continues to age, net migration’s contribution to population growth will only increase. The next set of blog posts summarizes an analysis of the origins of people moving to North Carolina as well as shifts in net migration between North Carolina and other states using migration data from the Internal Revenue Service (IRS). In this first blog post of the series, we look at overall net migration – comparing the 2021-22 IRS data to the same for 2011-12.
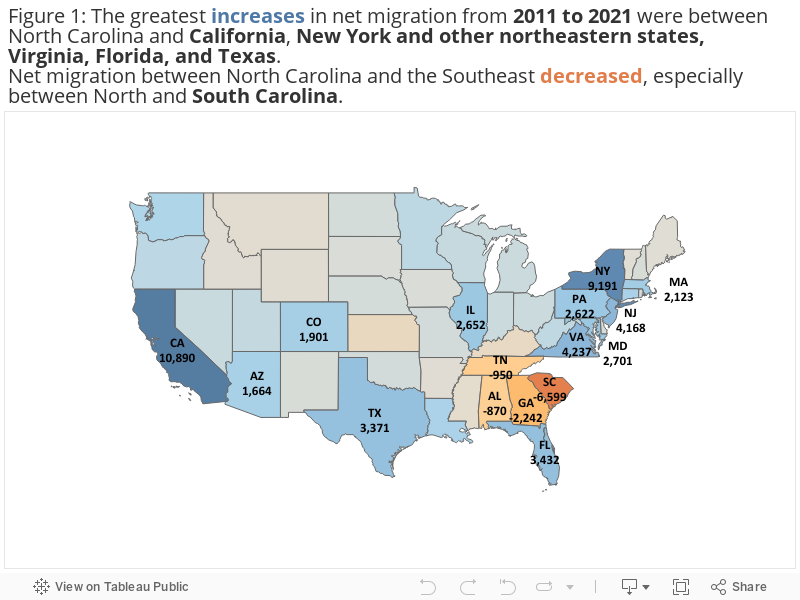
Fewer North Carolinians Leaving, More Moving from California, New York, and Other States
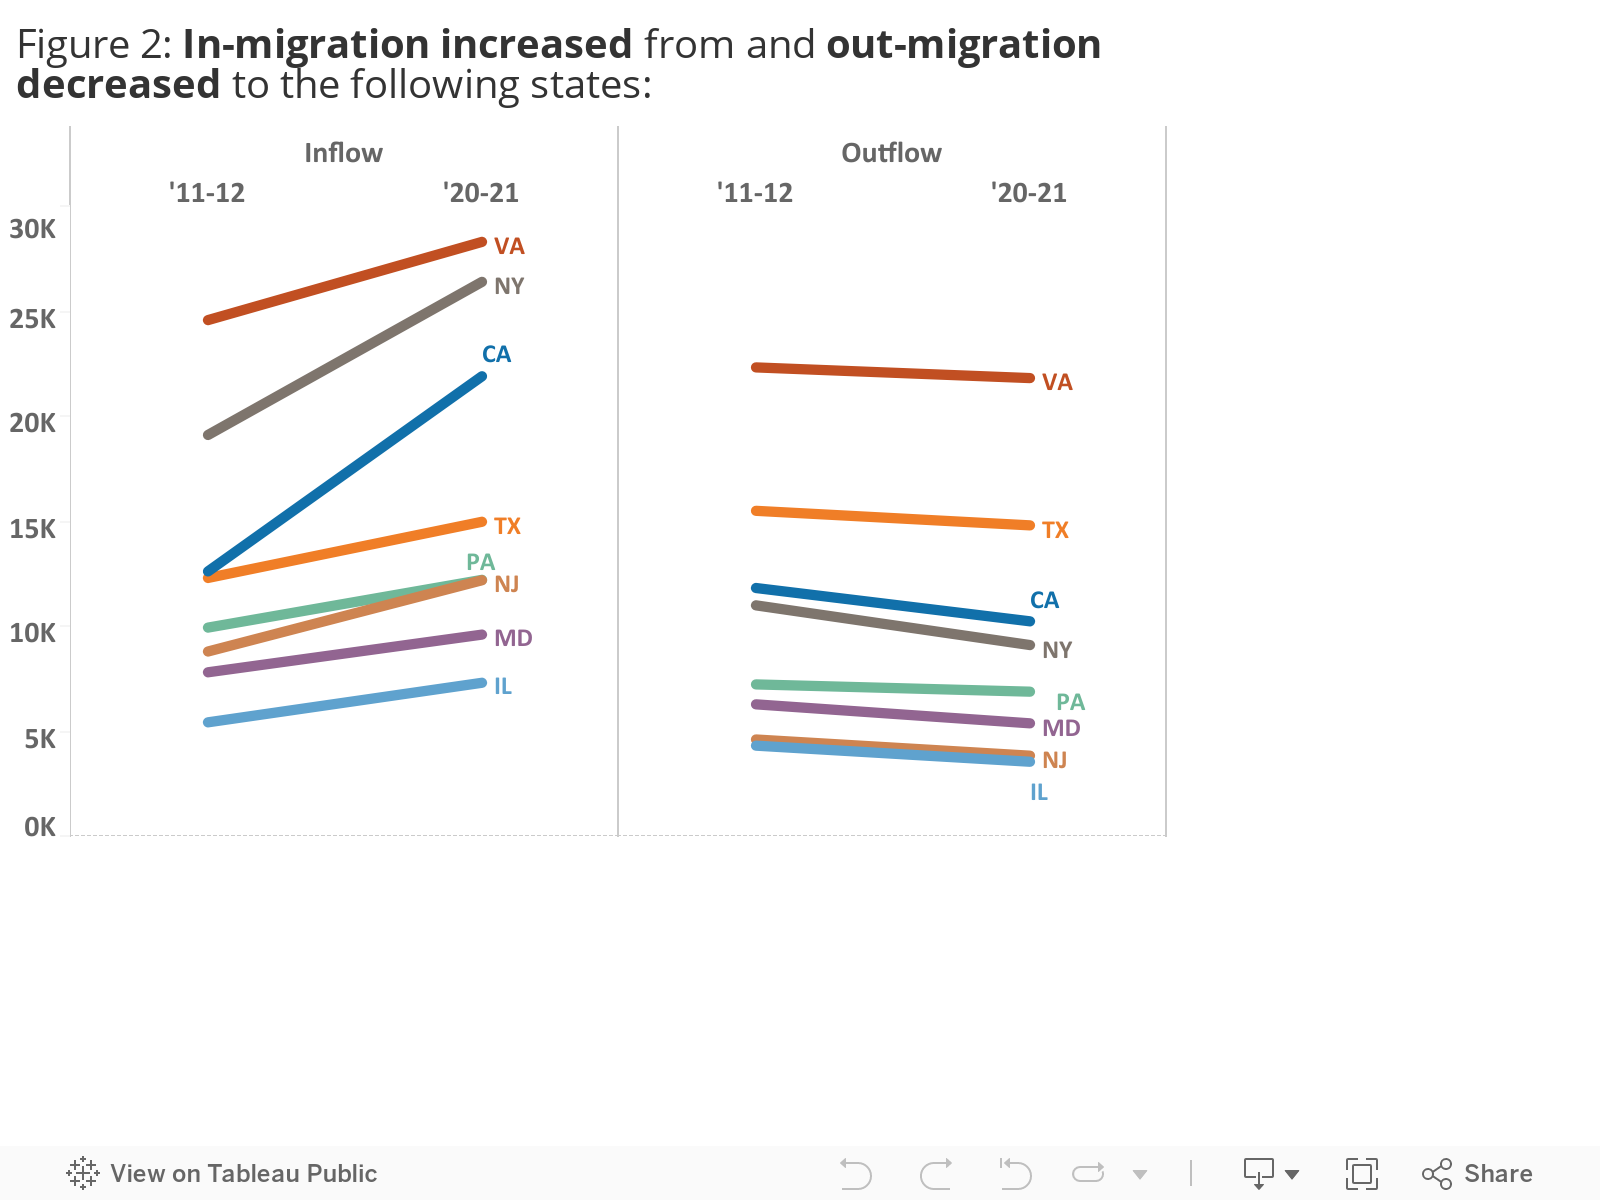
When comparing the most recent period (2020-21) to the earlier period (2011-12), we note that North Carolina experienced gains in net migration from most states with the largest increases in net migration from California (+10,890), New York (+9,191) and other northeastern states, Virginia, Florida, and Texas. These increases in net migration were due not only to increases in the number of people moving from these states but also to fewer North Carolinians leaving. However, North Carolina also experienced deepening levels of net migration losses to other Southern states including three of our neighbors - South Carolina, Georgia, and Tennessee.
Some State-to-State Migration Occurring Within Metropolitan Areas of Neighboring States
Most people who move, move a short distance. Thus, most of our state’s overall migration flows occur between our nearest neighboring states – with many migrants moving between adjacent counties of different states. In addition, North Carolina shares two metropolitan areas between neighboring states: Virginia Beach-Chesapeake-Norfolk, VA-NC (that includes Camden, Currituck, and Gates Counties in North Carolina) and Charlotte-Concord-Gastonia, NC-SC. There are more migrants from Virginia to North Carolina than those moving from North Carolina to Virginia – and many of those net gains are due to people moving away from Norfolk, Virginia to a suburbanizing county of that metropolitan region located in North Carolina. Similarly, some of the net losses to South Carolina are occurring within the Charlotte metropolitan area. Twenty-eight percent of migrants moving from North to South Carolina between 2020 and 2021 moved to York or Lancaster Counties in South Carolina, suburbs of the Charlotte metropolitan area. About half of the net difference between 2011-12 and 2021-22 can be attributed to moves between North Carolina and South Carolina counties within the Charlotte metropolitan area. Excluding those moves, the difference between the two periods drops to -3,330 instead of the -6,599 shown in Figure 1.
How do these trends stack up to the trends in our neighboring states?
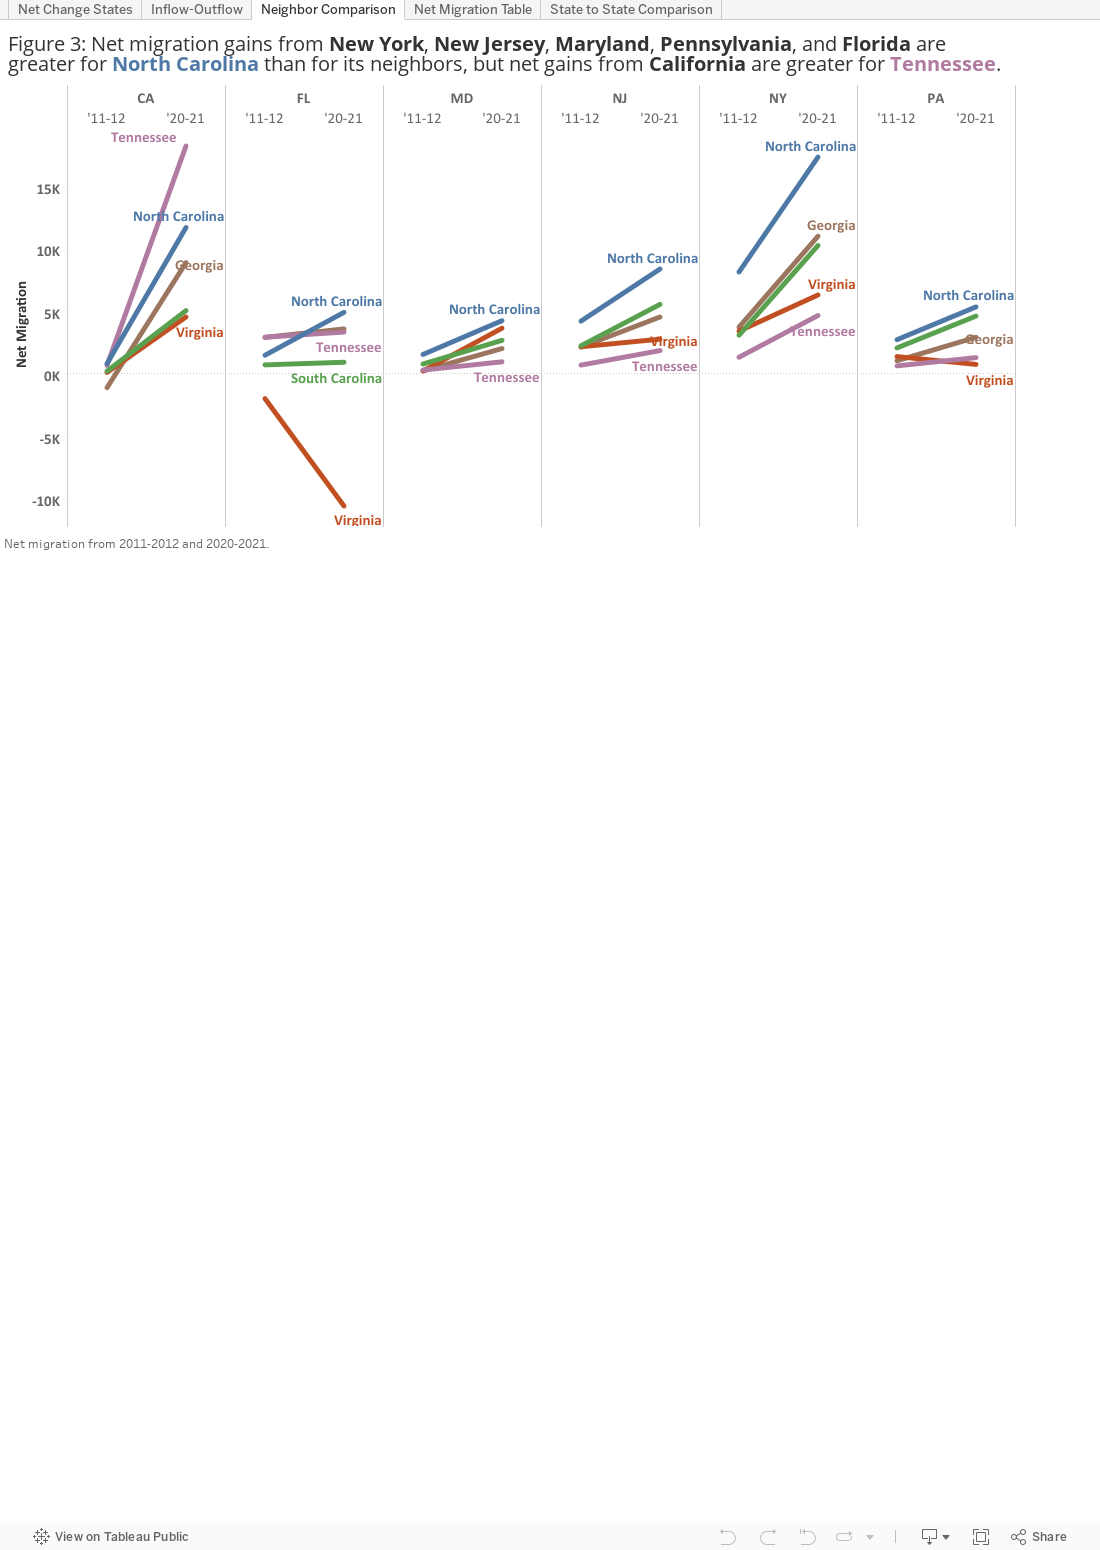
In 2011-12, the largest levels of net in-migration beyond North Carolina’s neighbors were from New York, New Jersey, Pennsylvania, Maryland, and Florida. In addition, over the course of the last decade, the number of people moving from California has increased substantially. North Carolina experienced greater gains in net migration from New York, New Jersey, Maryland, Pennsylvania, and Florida than its neighbors. There have long been migration streams between these northern states and North Carolina and North Carolina has become an increasingly important destination for retirees from Florida. Net migration from California has increased for all our neighboring states, but Tennessee experienced greater gains in net migration from California than all the other neighboring states and North Carolina. Likely this is due to Tennessee’s relative proximity to California and economic ties. According to analysis of 2022 Occupational Employment and Wages data from the Bureau of Labor Statistics, Nashville’s music-related employment is the third highest in the country behind New York City and Los Angeles and the highest when measured as a percent of all local employment.
Conclusion
North Carolina continues to be a desirable destination for domestic migrants. The level of net in-migration between most other states and North Carolina has increased over the last decade as more people move to the state and fewer leave. In our next blog post, we turn to a look at the shifts in the income and age characteristics of in-migrants to North Carolina and other states.
A Note on the Data
There are two components of population change – natural increase (births minus deaths) and net migration (people moving into an area minus those leaving). Of the two components of change, net migration is the most difficult to measure. Birth and deaths are registered with the government and include residence information. In the United States, there is no equivalent registration system for moves. Many different data sources are analyzed to get a clearer understanding of migration flows – including aggregated data from the IRS.
The IRS data include the number of filers and the number of exemptions. For this analysis, we assume that the number of exemptions equal the number of people. Net migration is determined by subtracting the number of people (exemptions) living in North Carolina in 2012 or 2021 who did not live there in 2011 or 2020 from the number of people (exemptions) living in other state in 2012 or 2021 after living in North Carolina in 2011 or 2020.
Like similar data sources, there are limitations to the IRS data. Not everyone files taxes, so some people are excluded from this analysis. However, most people do file and these analyses provide a general overview of domestic migration trends. Some researchers have raised concerns about volatility in the IRS migration data produced since 2011, but no concerns have been raised about the two sets of years used in this analysis: 2011-2012 and 2020-2021.
About the Authors
Joanna LeFebvre interned with the Demographic and Economic Analysis division of the Office of State Budget and Management. She is a graduate of the Master of Public Policy, Social Policy program at Duke University’s Sanford School of Public Policy.
Dr. Michael Cline is the State Demographer of North Carolina. In addition to publishing the state's annual population estimates and projections, Dr. Cline has authored or co-authored several books, book chapters and articles