
Editors note: Last fall, we summarized parts of an analysis prepared by our intern, Joanna LeFebvre. In those posts, we summarized her work in analyzing the characteristics and origins of migrants to North Carolina. In this post, we summarize migration patterns and trends experienced in North Carolina counties.
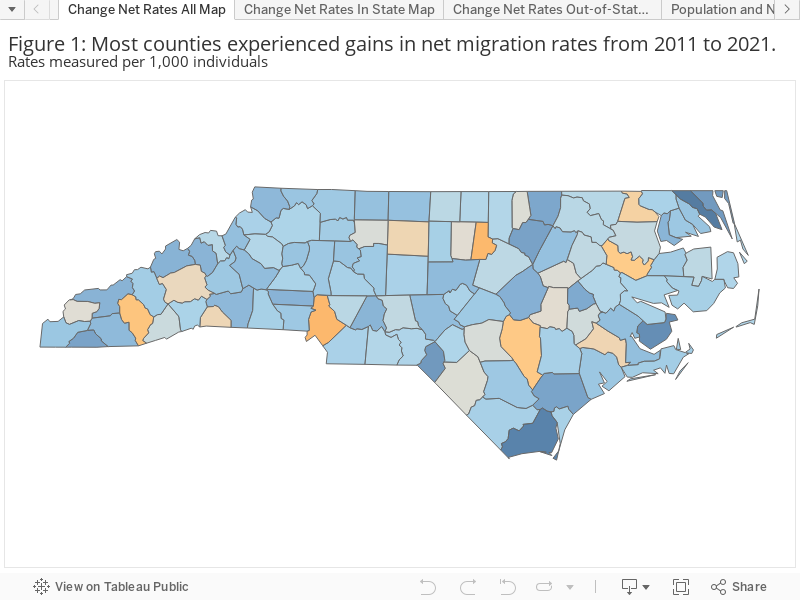
We measure net migration as the difference between the number of migrants moving to a North Carolina county and the number leaving that same county — here defined as the number of filers and their dependents listed in the migration data from the Internal Revenue Service (IRS). In order to compare counties with a range of population sizes, we divide net migration by the total number of filers and dependents within the same county. A positive rate indicates that more people were moving into a county than leaving while a negative rate indicates that more people were leaving a county than arriving.
Overall, most counties experienced increases in the level of in-migration between the early period (2011-12) and the latter one (2020-21). The number of counties experiencing net in-migration increased from 57 in the earlier period to 85 in the latter. The average rate of net migration for all North Carolina counties increased from 1.4 per 1,000 people in 2011-12 to 13.6 per 1,000 people in 2020-21.
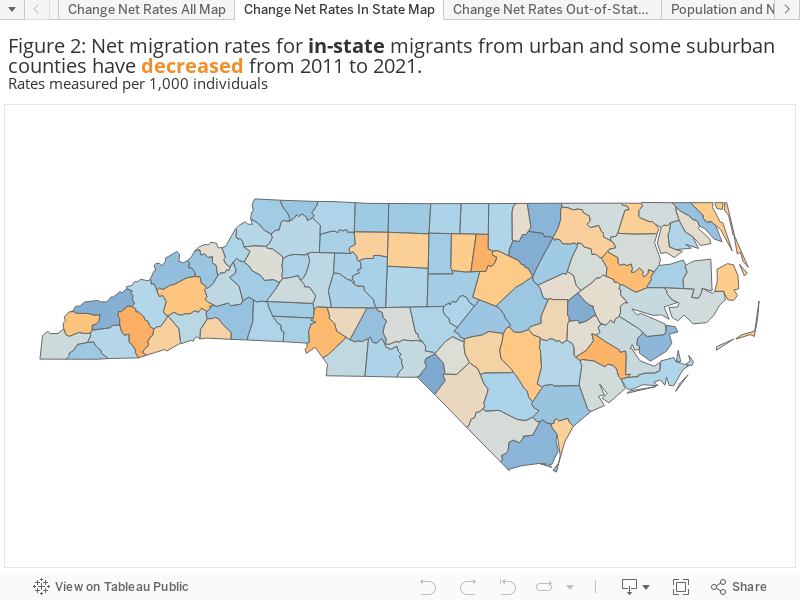
Suburban and Exurban Counties Draw In-State Migrants
With few exceptions, suburban and rural counties surrounding urban counties saw increasing rates of in-migration between the two periods – mostly from migrants moving from another North Carolina county. At the same time, all the six urban counties saw declines in in-state net migration. Even regional center counties show similar patterns – decreasing net migration of in-state migrants in the regional center county with concomitant increases of in-state migrants in the surrounding counties.
For example, the in-state net migration rate in Buncombe County, home to Asheville, decreased from 1.1 per 1,000 residents to -7.3 per 1,000 residents. That's a net change of -8.4. At the same time, Madison County, a rural county adjacent to Buncombe County, saw the rate shift from -7.0 per 1,000 residents to 12.9, which is a net change of 19.9.
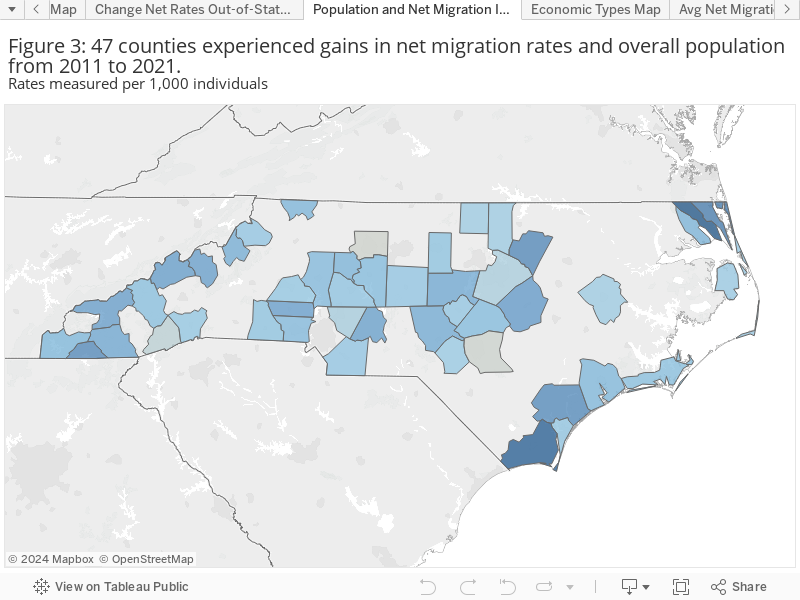
Migration an Important Contributor to Population Growth
Not every county that had more people moving to the county than leaving experienced population growth between 2011 and 2021. Net migration is just one component of population change – the other being natural increase (more births than deaths) or natural decrease (fewer births than deaths). An aging population means that all counties will become more reliant on net migration to make up for slowing natural population increase. Between 2011 and 2021, 47 counties that experienced population growth also experienced increases in net migration rates . These include 30 rural counties, 14 regional center/suburban counties, and 3 urban counties. Most of these counties are retirement destinations in the mountains or along the coast, or in the rapidly urbanizing Piedmont region.
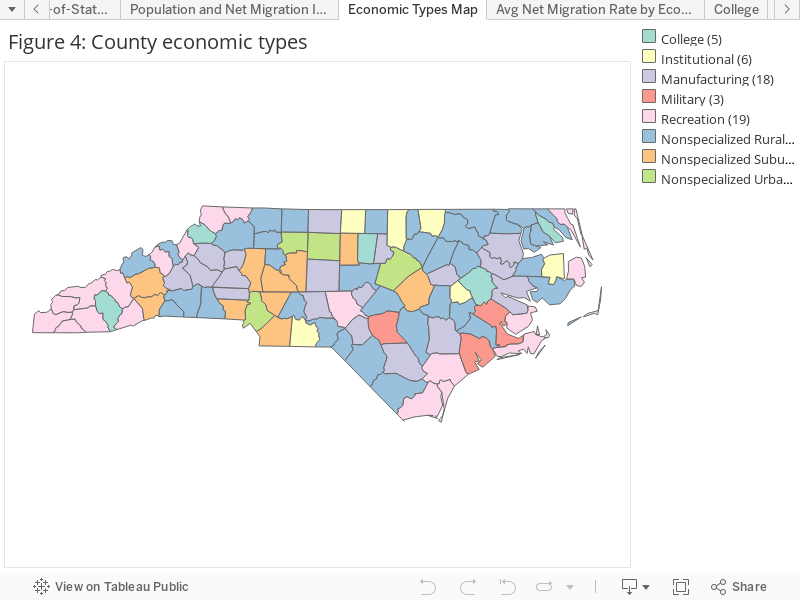
Migration Patterns Vary by County Economic Characteristics
In order to more fully understand change in migration patterns, we classified counties according to a combination of the economic types defined by the United States Department of Agriculture Economic Research Service (USDA-ERS) and the North Carolina Rural Center’s urban and rural classifications. We further refined USDA-ERS’s institutional category by separating three military counties and five college counties from the broader institutional classification. Institutional counties typically have a federal or state facility (such as a military base, federal or state penitentiary, or university) that includes populations proportionally large enough to influence migration patterns for the county. The county classifications are shown in Figure 4.
Recreation Counties Have Largest Gains in Net Migration Due to North Carolina’s Abundant Natural Resources and the Aging Baby Boom Generation
Recreation counties experienced the greatest increases in net migration rates, primarily driven by out-of-state migration. Rates of net migration increased from 5.5 per 1,000 people to 27.0 per 1,000 people for these counties.
At the same time, all county types saw increases in rates of net migration with the exception of our largest urban counties. These large urban counties saw increases in out-of-state rates of net migration, even as the overall rates and rates for in-state migration declined. These large counties have diverse economies with no single dominant industry so that they are classified as non-specialized. North Carolina also has many rural and suburban counties that are economically nonspecialized. Rural and suburban counties without specialized economies have experienced increases in both in-state and out-of-state net migration rates, on average.
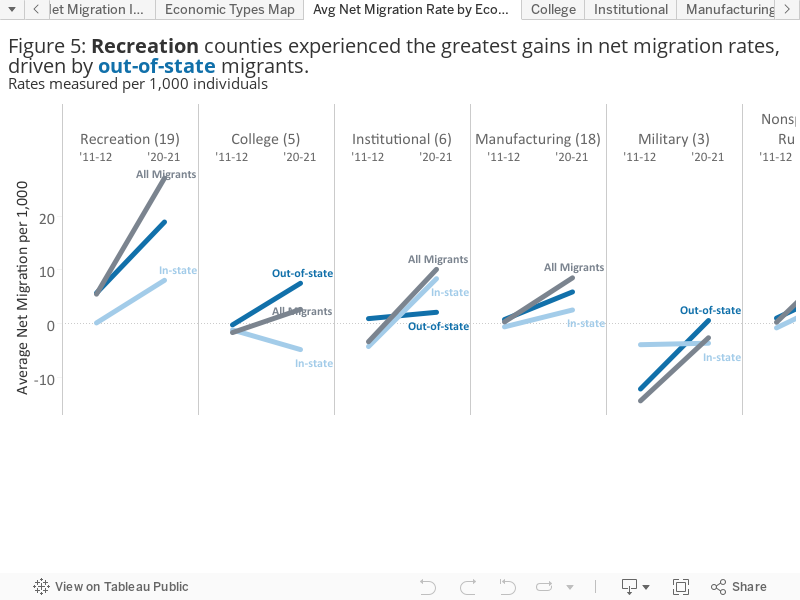
The 18 manufacturing dependent counties saw increases in both in-state and out-of-state net migration rates. In 2011-12, as the economy was recovering from the Great Recession, migration rates for these counties were just 0.3 per 1,000 overall. Between 2020 and 2021, migration rates were at 8.5 per 1,000 people, with out-of-state migration at 5.9 per 1,000 people.
The fourteen counties categorized as institutional by the USDA-ERS were further divided into college counties (5), military (3), and institutional (6).
The college counties are counties dominated by major universities that influence migration patterns – primarily of students moving to the county to enroll and moving away as they graduate. These counties include Pasquotank (Elizabeth City State University), Pitt (East Carolina University), Orange (University of North Carolina – Chapel Hill), Watauga (Appalachian State University), and Jackson (Western Carolina University).
Similarly, military populations in Cumberland (Ft. Liberty), Craven (Cherry Point and New River Air Stations), and Onslow (Camp LeJeune) are large enough to influence migration patterns for the overall population. Though migration rates can vary from year-to-year depending upon military movements, in general, these counties tend to show net out-migration owing to the nature of the ages of the personnel assigned to the various installations. Children are born in those counties and move away when their parents leave to another installation or military service altogether.
The remaining institutional counties are counties with relatively large prison populations. In-state migration rates remained flat or declined slightly for college and military counties but increased for the remaining institutional counties (likely influenced by where those counties are located relative to urban areas).
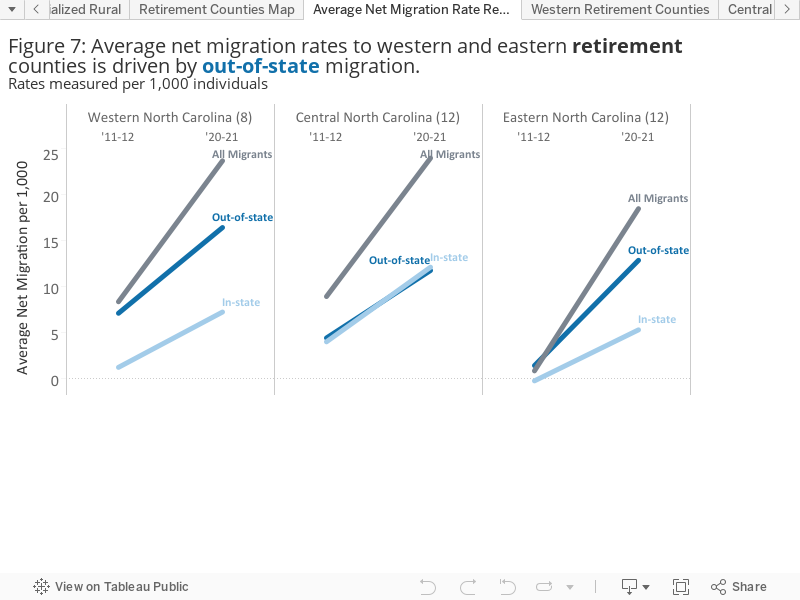
How Do Retirement Destinations Compare?
The USDA-ERS has another classification that identifies retirement destination counties. The current criteria for these counties include any county that experienced population growth of 15% or more in their 60+ population between 2000 and 2010. The 32 North Carolina counties defined as retirement destinations are shown in the map in Figure 7, further classified into three broad regions.
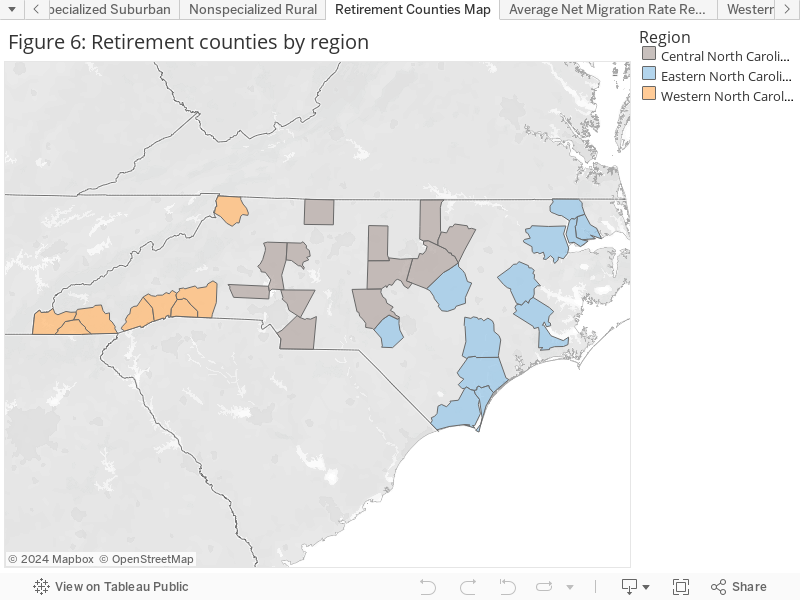
These retirement destination counties experienced sharp increases in net migration rates between the two periods. Gains in net migration to western and eastern retirement counties were driven by out-of-state migration while increases to central retirement counties were driven by both in-state and out-of-state migration. This suggests North Carolina’s mountains and coast continue to attract out-of-state migrants, with many moving to retire (although these data do not show the ages of migrants).
What do these patterns tell us?
In many ways, the patterns we see here confirm what we may see in our day-to-day travels and experiences throughout the state. Migration is increasingly an even more significant contributor to the population growth for North Carolina counties. Many counties are growing because of new migrants to the county. In others migration can help slow population decline.
Beyond this, we note that:
- Rates of net migration have increased since 2011-12 for most counties;
- Urban and regional center counties as well as recreational and retirement counties have gained most from out-of-state migrants; whereas,
- Suburban and exurban counties have experienced gains in migrants from other counties within North Carolina; but,
- Economic and locational factors play an important role in how significant of a role migration plays for any particular county.
*Joanna LeFebvre interned with the Demographic and Economic Analysis division of the Office of State Budget and Management in 2023. She is a graduate of the Master of Public Policy, Social Policy program at Duke University’s Sanford School of Public Policy.