Economic Outlook
Moderate growth expected through FY 2026-27 despite heightened uncertainty
Published April 11, 2026
Although economic growth softened in 2025 from the prior year along expectations, GDP growth at the national and state levels finished the year close to their long-term average, supported by resilient consumer spending. Despite tariffs rising to levels not seen since the 1930s, inflation held relatively steady due to slowing growth in housing costs counterbalancing rising goods inflation. Contrary to many economic forecasts from early 2025, corporate profits and equity values maintained their strength through the first months of 2026. However, job and wage growth have slowed notably across the US and in North Carolina, with both trends holding up better at the state level, and consumer sentiment remains historically low.
The US and North Carolina economies are expected to maintain moderate growth through 2027. Scheduled federal tax cuts to households and businesses and rising federal spending are likely to support consumer spending and boost investment in the near-term. If federal trade policy stabilizes and productivity growth sustains recent momentum, these factors will also contribute to economic growth through the remainder of the year.
The pace of overall economic growth may slow in 2027 as the impact of deficit-financed federal tax cuts and spending increases subside. Following three consecutive years of strong performance in the stock market, valuations are also likely to see slowing growth even if stocks recover recent losses incurred since the start of the Middle East conflict.
Although inflationary pressures remain elevated, price growth should remain stable at around 3%, assuming the Middle East conflict moves toward resolution in the near-term following a two-week partial ceasefire and negotiations announced April 7. However, the potential for renewed hostilities and an extended closure of the Strait of Hormuz presents a significant downside risk to this outlook. With inflation remaining above the Federal Reserve’s 2% target and heightened uncertainty about energy prices, markets (at the time of publication) predict no change in the federal funds rate at Federal Open Market Committee (FOMC) meetings until late in 2027.
High levels of uncertainty present positive and negative risks:
- The current conflict in the Middle East has increased prices for energy commodities, and those prices are unlikely to immediately return to pre-conflict levels even after the conflict eases. This conflict has raised the risk of a global recession, as businesses and consumers respond to higher costs by cutting spending and investment.
- Faster-than-expected adoption or breakthroughs in AI technology may lift productivity, output, and wages, but also have the potential to reduce employment, particularly for entry-level white-collar occupations, or drive stock market selloffs.
- Renewed trade tensions could exert upward pressure on prices for goods.
- Widening income inequality could further decouple economic growth from financial wellbeing for low- and middle-income households.
Corporate profits at record levels but expected to moderate
National after-tax corporate profits reached a record $3.6 trillion in the third quarter of 2025, up 11% year over year and well above their pre-pandemic share of national income.1
Profit growth was led by finance and insurance, information services, and professional and technical services sectors. However, gains have not been shared evenly by business size. Nonfarm proprietors' income, a proxy for small business profits, fell sharply in early 2025 and remained roughly 4% below its late-2024 level through the end of the year.2
Technology and finance are likely to continue a trend of strong growth in profits, supported by AI-related investment. Health insurers, by contrast, saw a sharp deterioration in 2025 as medical costs outpaced premium increases.3 Manufacturing faces the most uncertainty from tariff-driven cost increases on imported materials, a risk with direct implications for North Carolina's growing aerospace, battery, and pharmaceutical manufacturing base.
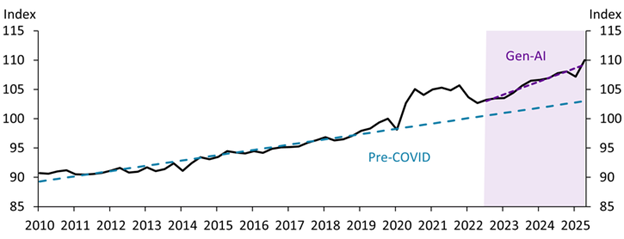
The concentration of profit gains in service industries partly reflects early AI adoption. Research from the Federal Reserve Bank of Kansas City finds that labor productivity is above its pre-pandemic trend since late 2022. It remains unclear how quickly AI adoption will spread, how large the productivity gains will be, and how those gains will be divided among AI companies, businesses that successfully integrate AI tools into their business model, and workers.
Chart: Labor productivity has moved farther above its pre-pandemic trend since late 2022
OSBM anticipates robust growth in corporate profits for US companies this year, likely in the range of 5%-10%, with a deceleration or modest decline in 2027.
Reasons for the potential decline in growth include:
- Tariff-driven cost hikes have increased costs across industries.
- The Middle East conflict has driven up the price of energy and other key business inputs. Even if the recent ceasefire results in an end to hostilities, higher input and energy costs will erode profits, especially for manufacturers, farmers, and construction firms.
- A sustained decline in equity valuations would depress consumer spending, particularly among high-income households and wealthy retirees.
Higher energy prices increase the profitability of energy producers, but the economic benefits would only materialize in the handful of states with major oil, gas, and mining operations.
Wage gains slowing, particularly for low-wage workers
North Carolina's labor market has outperformed the nation’s but has cooled from the hot post-pandemic recovery labor market.
Job growth in North Carolina was consistently above 2% during the recovery from the COVID-19 pandemic until the beginning of 2024. Based on the revised state employment data published on April 7, job growth cooled significantly in 2024 and 2025, with the latest reading showing year-over-year job growth of 41,900 (+0.8%) in January 2026. The state’s slowing job growth based on recently revised data is consistent with national trends.
The February 2026 benchmark revision to national job numbers reduced the December 2025 employment level by nearly 1.1 million jobs (-0.7%), confirming that job growth was substantially weaker than initially reported. Although job growth in North Carolina remains higher than elsewhere, the state’s downward revision of 51,600 jobs (-1%) for the level of employment in December 2025 narrowed the gap between the state and the nation.
Wage growth has remained positive, but gains are increasingly uneven. Statewide, average wages grew roughly 4% year over year through the third quarter of 2025, down from a peak of over 6% in 2022. However, this average masks a widening gap by income level. According to the Atlanta Fed's Wage Growth Tracker, wage growth for workers in the bottom quartile has slowed from approximately 7.5% at its late-2022 peak to roughly 3.5% by late 2025 and early 2026. Workers in the upper half had lower peak wage growth in 2022 and 2023, but recent wage growth for these workers has held up better as the labor market cooled and was 4.2% in the first months of 2026.
The uneven distribution of wage gains could erode household financial wellbeing for lower- and middle-income families if the trend persists. This would narrow the base of income growth that supports the state's economy.
OSBM expects North Carolina to add approximately 30,000 to 40,000 net jobs in calendar year 2026, with the unemployment rate rising from 3.8% in January to approximately 4.4% by the end of the year. Unemployment is likely to rise further if manufacturers, construction firms, and other businesses are unable to absorb tariff-driven cost increases and higher energy prices.
Consumer spending is resilient but gaps by income grow
Consumer spending, a critical part of economic growth, has begun to diverge across income levels. Higher-income households account for most spending growth as lower- and middle-income households have reduced spending by curbing discretionary purchases. Many economists have characterized this pattern as a “K-shaped” economy. Although most data on spending and income distribution are only available at the national level, experimental data from the Bureau of Economic Analysis show that North Carolinians in the top fifth by income were pulling ahead of others as of 2023. North Carolina was also the only state with a statistically significant increase in inequality in 2024, according to state-level Census Bureau data.
February credit card data from Bank of America shows that year-over-year spending growth was 1.1% for households with incomes in the bottom third compared to 2.9% for households in the top third and 1.7% for middle-income households. While the size of this differential has fluctuated, the gap is larger than in prior years.4 The BLS Consumer Expenditure Survey shows that total annual expenditures have grown more slowly for those in the lowest income quintile compared to those in the middle- and highest-income quintiles since 2020.
Chart: Spending Grows Slowest for Lowest Income Quintile Since 2020
Total Average Annual Expenditures Index, January 2020 = 100
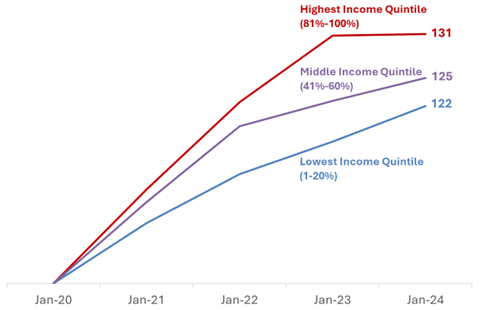
Limited wage growth, the cumulative impact of multi-year inflation, and warning signs in the labor market likely play a role in lower- and middle-income households’ muted spending growth. Higher-income households are likely to see a larger increase in average net income over the long-term based on analyses by the Congressional Budget Office and The Budget Lab at Yale.5 These higher-income households are also less affected by elevated inflation, including the recent rise in energy prices, and are more likely to cut spending in response to falling asset prices.
Although OSBM expects overall consumer spending to remain stable through 2027, continued divergence in the economic fortunes of low-, middle-, and high-income households could reduce economic resiliency for a large share of the population.
Western North Carolina economic recovery moves forward
The people of western North Carolina have been engaged in rebuilding and recovery efforts following the historic destruction caused by Hurricane Helene in September 2024. This region includes several centers of economic activity, including hubs for tourism and travel, furniture and textile manufacturing, and education.
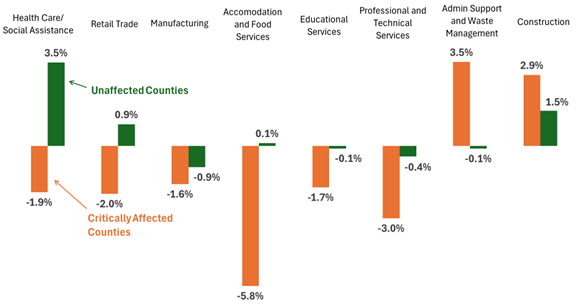
While counties in North Carolina with little-to-no Helene impacts saw modest employment growth in the 12 months after Helene, counties in the path of the storm experienced a decrease in total employment and are still experiencing comparatively slower employment growth.6 Job losses in the first 12 months post-Helene were widespread across sectors, but most pronounced in tourism. The impact on regional tourism is reflected in occupancy tax collections in Buncombe County, which have consistently remained below pre-storm levels through 2025.
A few industries integral to the region’s recovery, particularly construction and waste management, have experienced more job growth than in other parts of the state. Sales tax collections have also rebounded in many affected areas, likely due in part to home repairs and property replacement. Despite these improvements, a full recovery will take years and will require continuing support for households and businesses.
Largest Sectors Have Higher Employment Losses in Helene-Affected Counties
over-the-year growth in QCEW employment, September 2024 to September 2025
- 1
U.S. Department of Commerce, Bureau of Economic Analysis.
- 2
U.S. Department of Commerce, Bureau of Economic Analysis.
- 3
NAIC, "Mid-Year 2025 Health Insurance Industry Analysis Report."
- 4
- 5
Data File 2025-12 OBBBA Tariffs Distribution December Update (Excel file)
- 6
April 2026 NC Economy Watch: Data Revisions Point to a Widespread Labor Market Slowdown